from mpl_toolkits.axes_grid.parasite_axes import SubplotHost
import matplotlib.pyplot as plt
import numpy as np
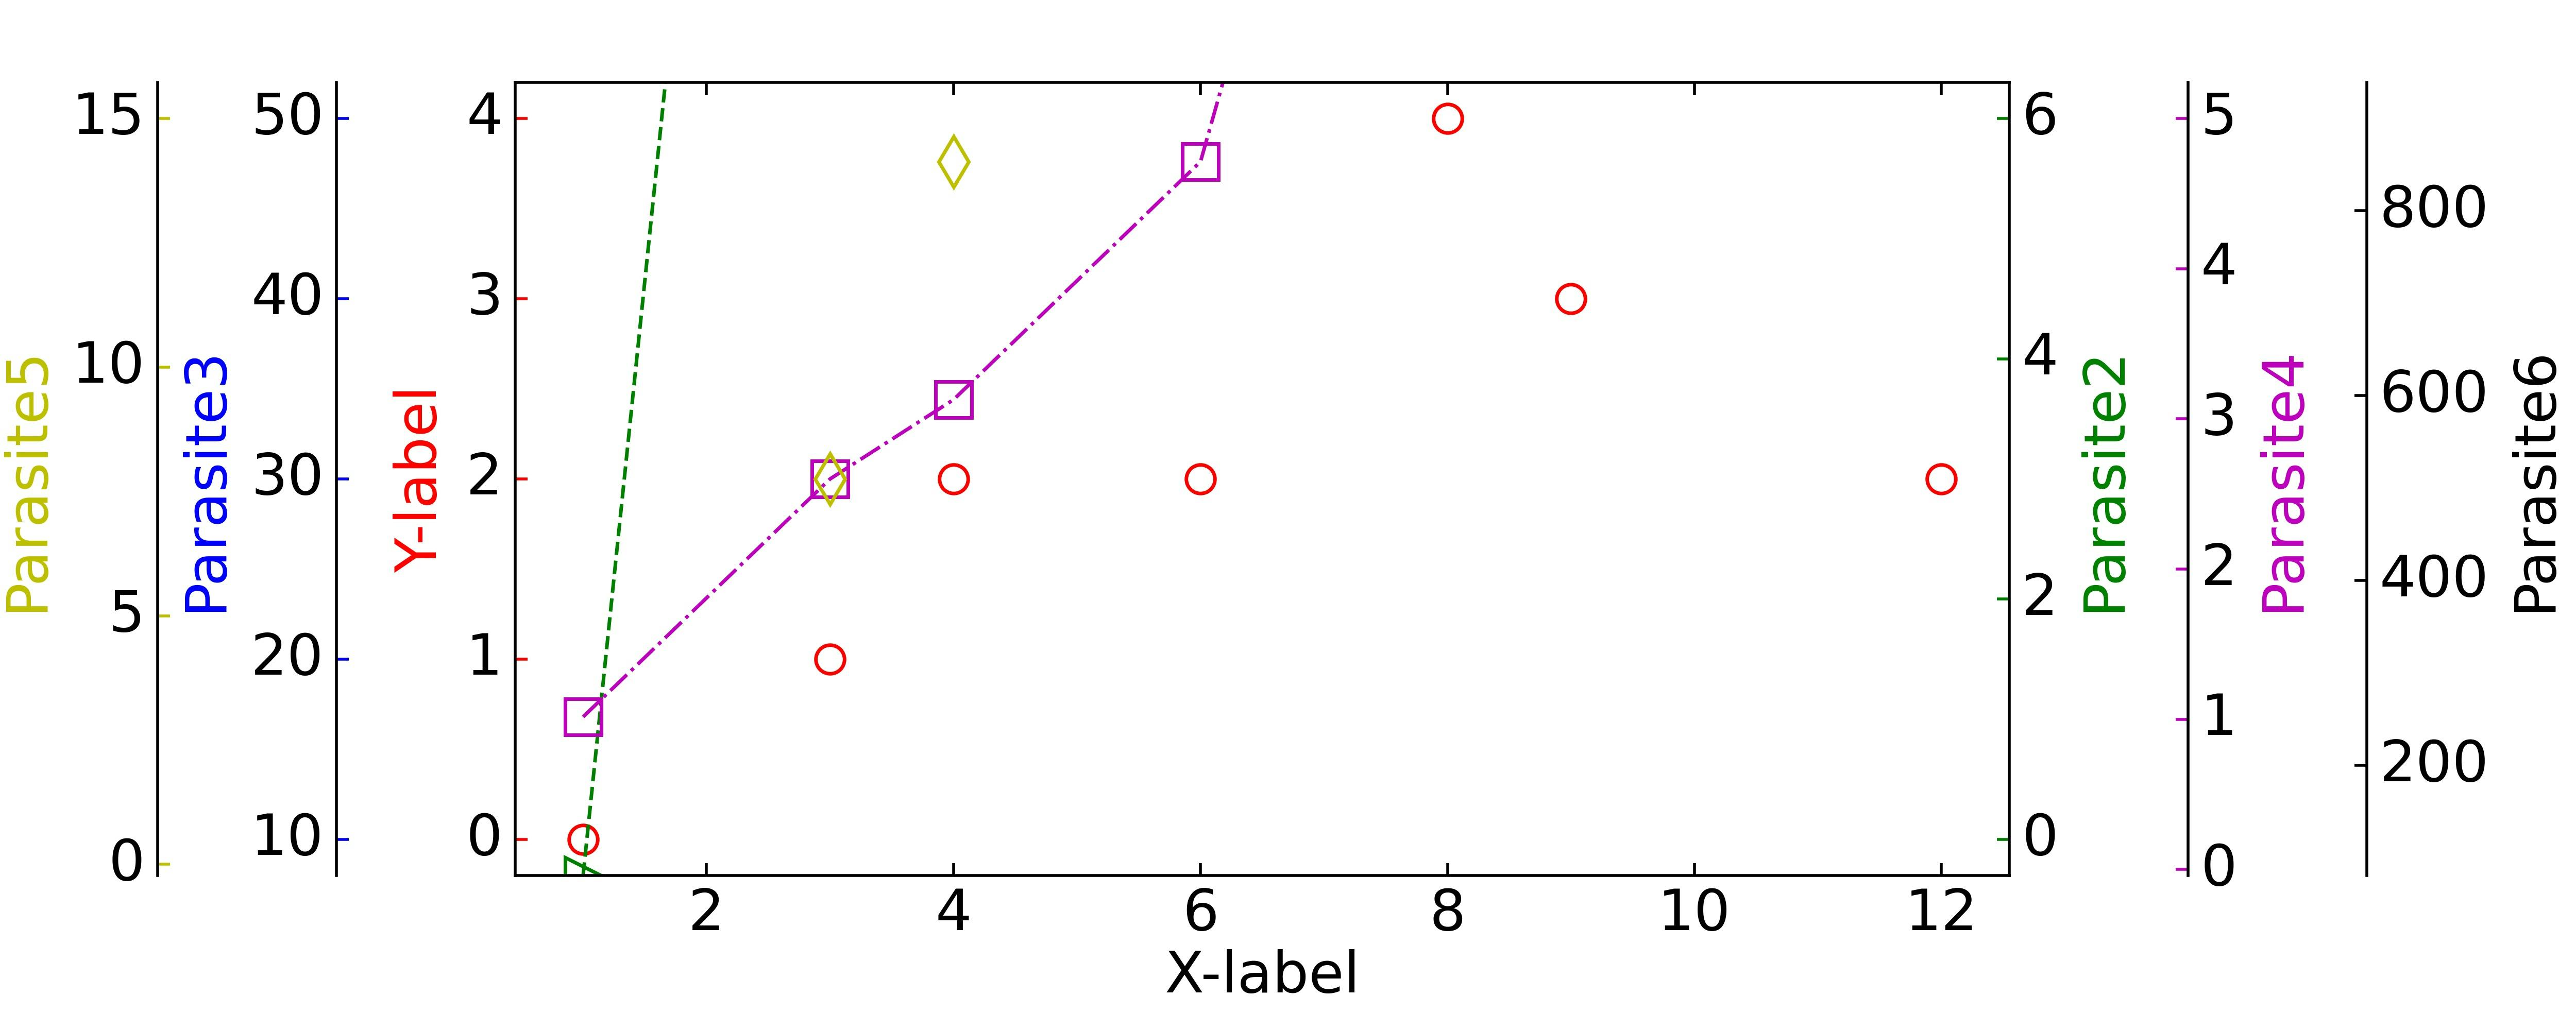
x = (1, 3, 4, 6, 8, 9, 12)
y1 = (0, 1, 2, 2, 4, 3, 2)
y2 = (0, 3, 2, 3, 6, 4, 5)
y3 = (50, 40, 40, 30, 20, 22, 10)
y4 = (0.2, 0.5, 0.6, 0.9, 2, 5, 2)
y5 = (2, 0.5, 0.9, 9, 12, 15, 12)
y6 = (200, 500, 900, 900, 120, 150, 120)
class multiY():
def __init__(self, height, width, X, LY, Xlabel, LYlabel, linecolor,
set_marker, set_linestyle, fontsize, set_markersize,
set_linewidth, set_mfc, set_mew, set_mec):
self.X = X
fig = plt.figure(figsize=(height, width))
self.host = SubplotHost(fig, 111)
plt.rc("font", size=fontsize)
self.host.set_xlabel(Xlabel)
self.host.set_ylabel(LYlabel)
p1, = self.host.plot(X, LY, color=linecolor, marker=set_marker, ls=set_linestyle, ms=set_markersize, lw=set_linewidth, mfc=set_mfc, mew=set_mew, mec=set_mec)
fig.add_axes(self.host)
self.host.axis["left"].label.set_color(p1.get_color())
self.host.tick_params(axis='y', color=p1.get_color())
def parasites(self, set_offset, PY, PYlabel, side, Plinecolor,
Pset_marker, Pset_linestyle, Pset_markersize, Pset_linewidth, Pset_mfc, Pset_mew, Pset_mec):
par = self.host.twinx()
par.axis["right"].set_visible(False)
offset = (set_offset, 0)
new_axisline = par.get_grid_helper().new_fixed_axis
par.axis["side"] = new_axisline(loc=side, axes=par, offset=offset)
par.axis["side"].label.set_visible(True)
par.axis["side"].set_label(PYlabel)
p2, = par.plot(self.X, PY,color=Plinecolor, marker=Pset_marker, ls=Pset_linestyle, ms=Pset_markersize, lw=Pset_linewidth, mfc=Pset_mfc, mew=Pset_mew, mec=Pset_mec)
par.axis["side"].label.set_color(p2.get_color())
par.tick_params(axis='y', colors=p2.get_color())
aa = multiY(10, 4, x, y1, "X-label", "Y-label", "r", "o", "None", 16, 8, 2, "none", "1", "r")
aa.parasites(0, y2, "Parasite2", "right", "g", ">", "--", 10, 1, "none", "1", "g")
aa.parasites(-50, y3, "Parasite3", "left", "b", "<", "-", 10, 1, "none", "1", "b")
aa.parasites(50, y4, "Parasite4", "right", "m", "s", "-.", 10, 1, "none", "1", "m")
aa.parasites(-100, y5, "Parasite5", "left", "y", "d", "none", 10, 1, "none", "1", "y")
aa.parasites(100, y6, "Parasite6", "right", "k", "*", "--", 10, 1, "none", "1", "k")
plt.subplots_adjust(left=0.20, bottom=0.15, right=0.78, top=0.92, wspace=0.05, hspace=0)
plt.savefig('aa.jpg',dpi=500)
plt.show()