from __future__ import (absolute_import, division, print_function)
import matplotlib
import matplotlib.pyplot as plt
import cartopy.crs as ccrs
import cartopy.feature as cfeature
matplotlib.rc('font', size=6)
pcar = ccrs.PlateCarree()
ncol = 4
sy = 3.5
sx = 3.5
global_projs = [pcar,
ccrs.Mercator(),
ccrs.AlbersEqualArea(),
ccrs.AzimuthalEquidistant(central_longitude=90),
ccrs.LambertConformal(),
ccrs.LambertCylindrical(),
ccrs.Miller(),
ccrs.Mollweide(),
ccrs.Orthographic(),
ccrs.Robinson(),
ccrs.Sinusoidal(),
ccrs.Stereographic(),
ccrs.TransverseMercator(),
ccrs.InterruptedGoodeHomolosine(),
ccrs.OSGB(),
ccrs.EuroPP(),
ccrs.Geostationary(),
ccrs.NearsidePerspective(central_latitude=50.72,
central_longitude=-3.53,
satellite_height=10000000.0),
ccrs.Gnomonic(),
ccrs.LambertAzimuthalEqualArea(),
ccrs.NorthPolarStereo(),
ccrs.OSNI(),
]
nrow = (len(global_projs)-1)//ncol + 1
fig = plt.figure(figsize=(sx*ncol, nrow * sy))
print('GLOBAL')
for ip, proj in enumerate(global_projs):
print(' '+proj.__class__.__name__)
ax = plt.subplot(*(nrow, ncol, ip+1), projection=proj)
ax.gridlines(pcar, draw_labels=True)
for feature in [cfeature.OCEAN, cfeature.LAND, cfeature.COASTLINE]:
ax.add_feature(feature)
ax.set_title(proj.__class__.__name__ + ' global')
fig.savefig('global.png')
fig.tight_layout(h_pad=1.5, w_pad=1.5, pad=0.1)
fig.savefig('global.png')

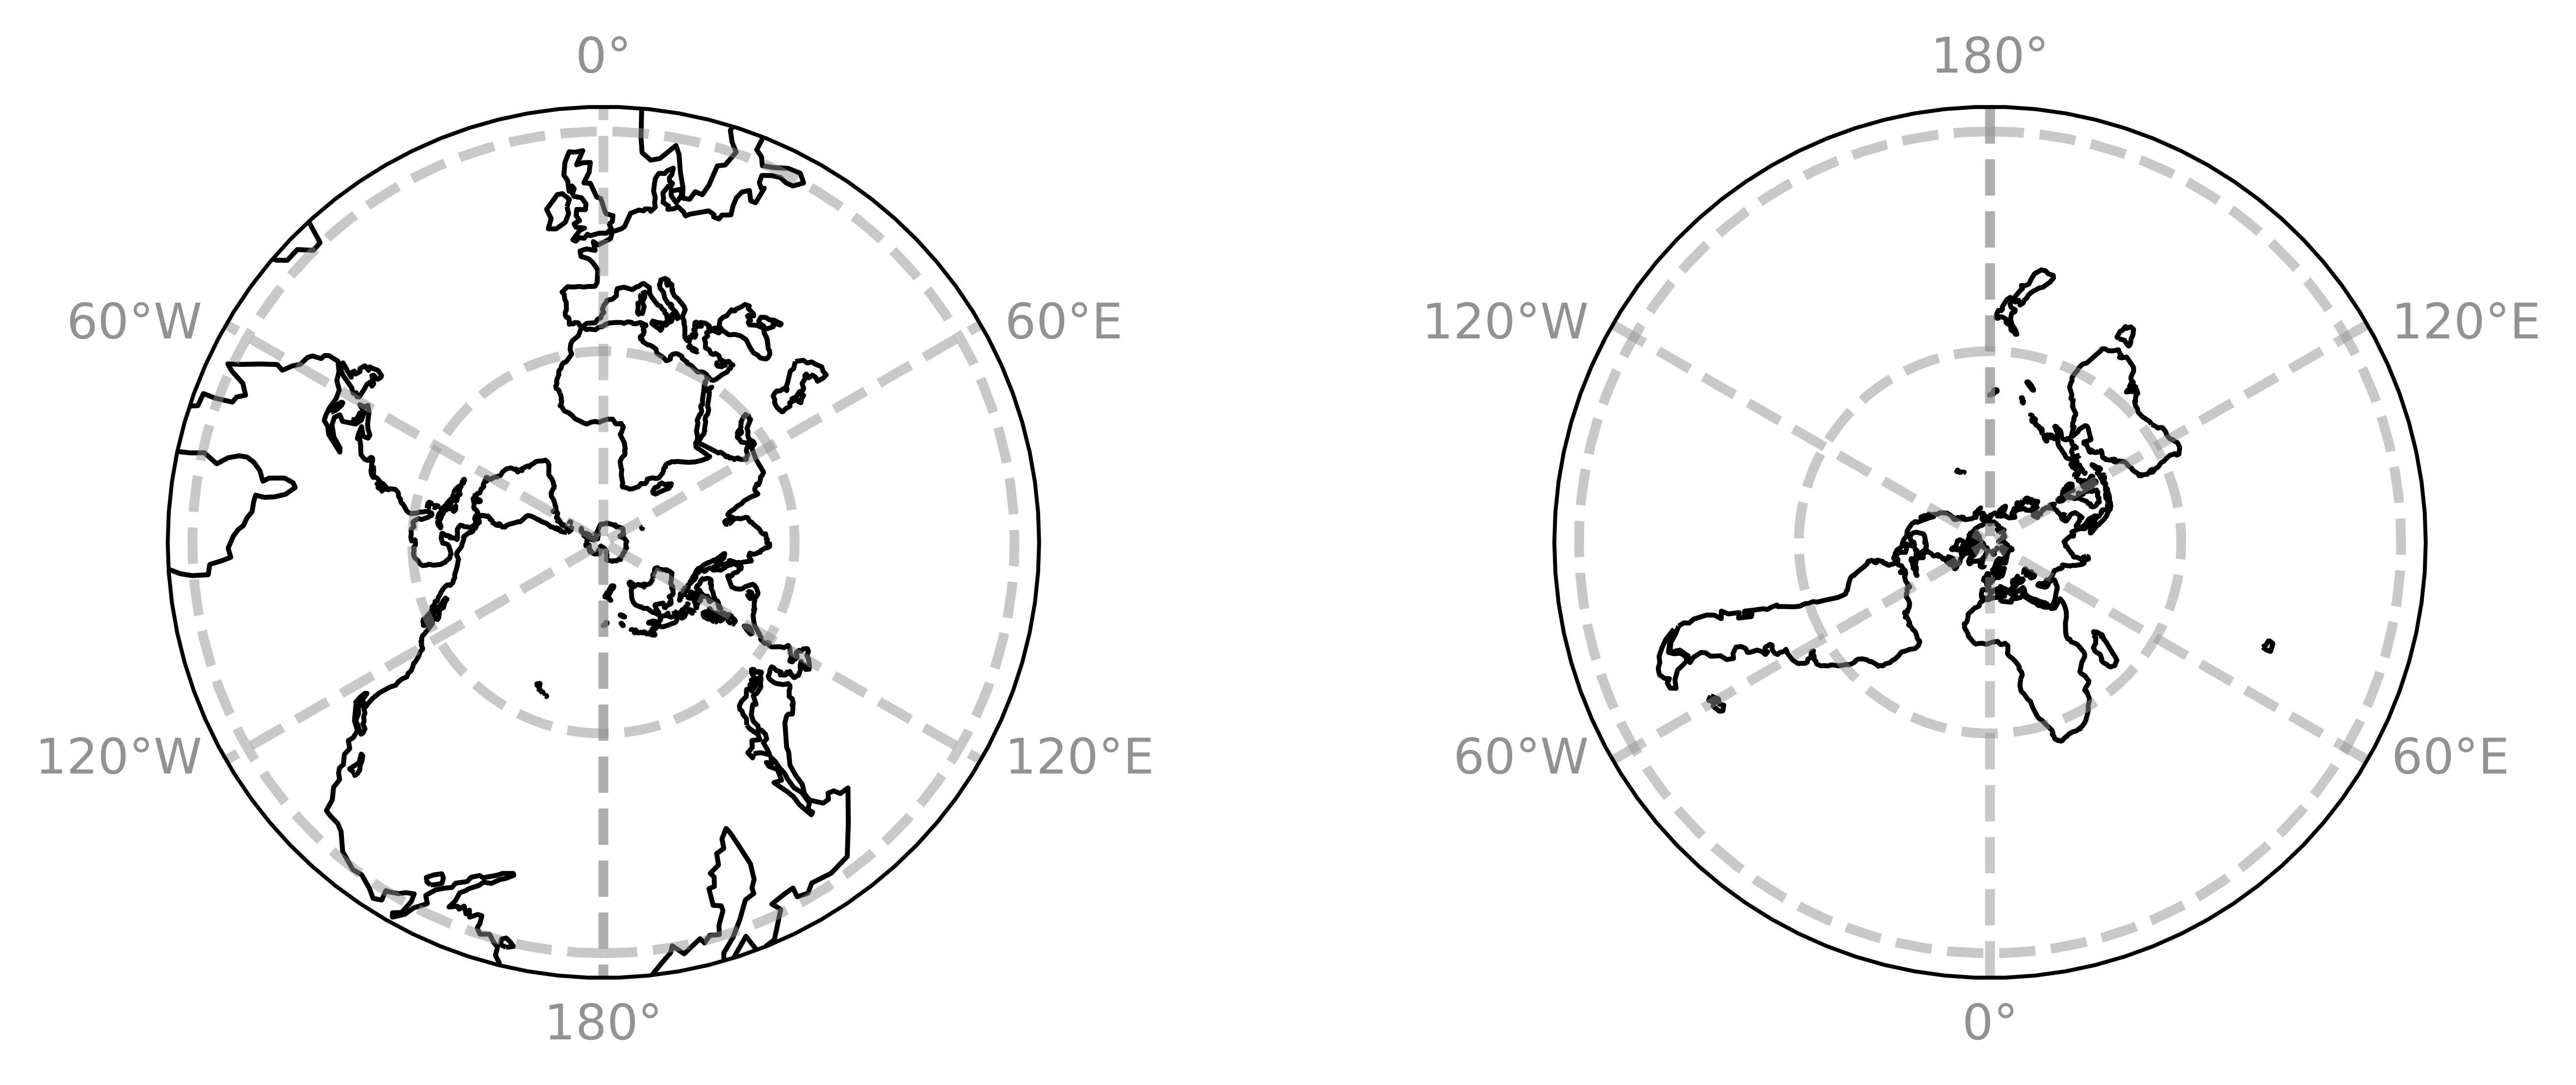
fig = plt.figure(figsize=(8,8))
ax=plt.subplot(*(3, 2, 1), projection=ccrs.SouthPolarStereo())
ax.add_feature(cfeature.COASTLINE, facecolor='lightgray')
gl=ax.gridlines( draw_labels=True,auto_inline=False,linewidth=2, color='gray', alpha=0.5, linestyle='--',)
gl.rotate_labels=False
gl.ylocator = mticker.FixedLocator([30, 60, 90])
gl.xlabel_style = {'size': 10, 'color': 'gray'}
plt.tight_layout()
ax=plt.subplot(*(3, 2, 2), projection=ccrs.NorthPolarStereo())
ax.add_feature(cfeature.COASTLINE, facecolor='lightgray')
gl=ax.gridlines( draw_labels=True,auto_inline=False,linewidth=2, color='gray', alpha=0.5, linestyle='--',)
gl.rotate_labels=False
gl.ylocator = mticker.FixedLocator([-30, -60, -90])
gl.xlabel_style = {'size': 10, 'color': 'gray'}
plt.tight_layout()
fig.savefig('p2.pdf',dpi=500, bbox_inches = 'tight')
from copy import copy

%matplotlib inline
import cartopy.crs as ccrs
from cartopy.mpl.gridliner import LATITUDE_FORMATTER, LONGITUDE_FORMATTER
import matplotlib.pyplot as plt
import numpy as np
import shapely.geometry as sgeom

import cartopy.feature as cfeature

from mpl_toolkits.axes_grid.inset_locator import inset_axes
import proplot as plot
def find_side(ls, side):
"""
Given a shapely LineString which is assumed to be rectangular, return the
line corresponding to a given side of the rectangle.
"""
minx, miny, maxx, maxy = ls.bounds
points = {'left': [(minx, miny), (minx, maxy)],
'right': [(maxx, miny), (maxx, maxy)],
'bottom': [(minx, miny), (maxx, miny)],
'top': [(minx, maxy), (maxx, maxy)],}
return sgeom.LineString(points[side])
def lambert_xticks(ax, ticks):
"""Draw ticks on the bottom x-axis of a Lambert Conformal projection."""
te = lambda xy: xy[0]
lc = lambda t, n, b: np.vstack((np.zeros(n) + t, np.linspace(b[2], b[3], n))).T
xticks, xticklabels = _lambert_ticks(ax, ticks, 'bottom', lc, te)
ax.xaxis.tick_bottom()
ax.set_xticks(xticks)
ax.set_xticklabels([ax.xaxis.get_major_formatter()(xtick) for xtick in xticklabels])
def lambert_yticks(ax, ticks):
"""Draw ricks on the left y-axis of a Lamber Conformal projection."""
te = lambda xy: xy[1]
lc = lambda t, n, b: np.vstack((np.linspace(b[0], b[1], n), np.zeros(n) + t)).T
yticks, yticklabels = _lambert_ticks(ax, ticks, 'left', lc, te)
ax.yaxis.tick_left()
ax.set_yticks(yticks)
ax.set_yticklabels([ax.yaxis.get_major_formatter()(ytick) for ytick in yticklabels])
def _lambert_ticks(ax, ticks, tick_location, line_constructor, tick_extractor):
"""Get the tick locations and labels for an axis of a Lambert Conformal projection."""
outline_patch = sgeom.LineString(ax.outline_patch.get_path().vertices.tolist())
axis = find_side(outline_patch, tick_location)
n_steps = 30
extent = ax.get_extent(ccrs.PlateCarree())
_ticks = []
for t in ticks:
xy = line_constructor(t, n_steps, extent)
proj_xyz = ax.projection.transform_points(ccrs.Geodetic(), xy[:, 0], xy[:, 1])
xyt = proj_xyz[..., :2]
ls = sgeom.LineString(xyt.tolist())
locs = axis.intersection(ls)
if not locs:
tick = [None]
else:
tick = tick_extractor(locs.xy)
_ticks.append(tick[0])
ticklabels = copy(ticks)
while True:
try:
index = _ticks.index(None)
except ValueError:
break
_ticks.pop(index)
ticklabels.pop(index)
return _ticks, ticklabels
'''
proj2=ccrs.LambertConformal(central_latitude=90,central_longitude=115)
proj=ccrs.LambertConformal(central_latitude=90,central_longitude=105,false_easting=400000, false_northing=400000,
standard_parallels=(46, 49))
'''
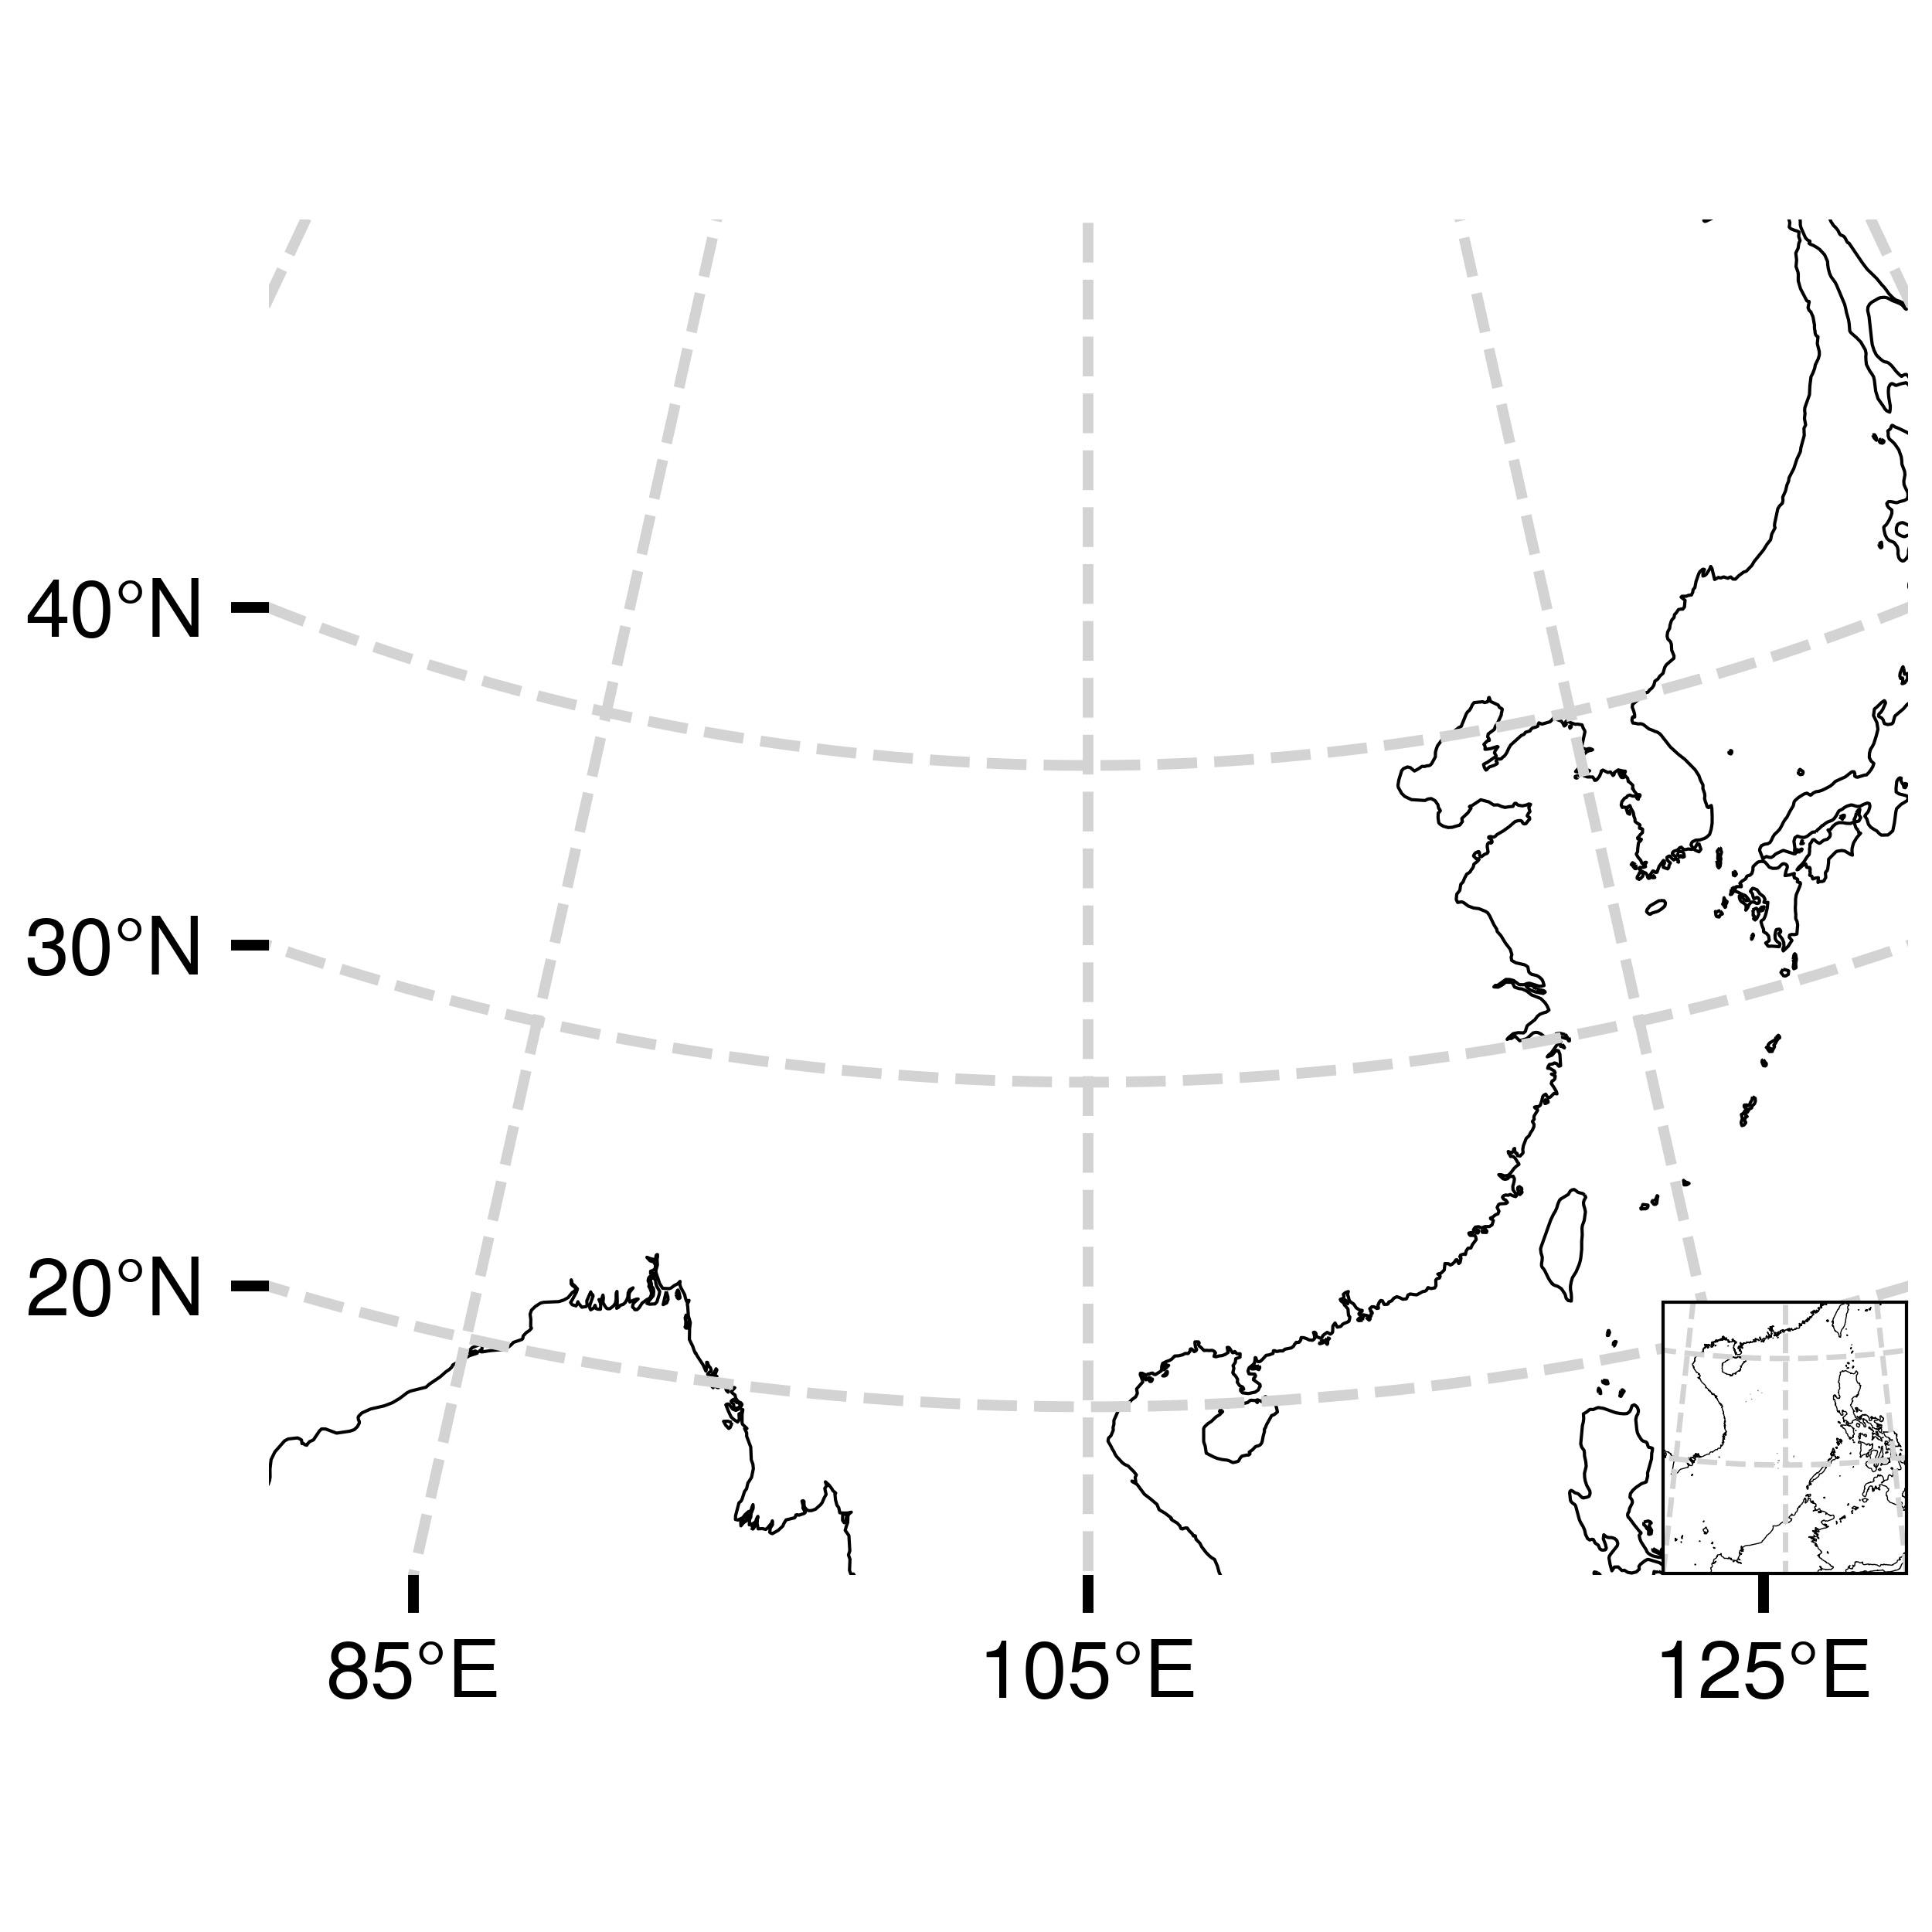
proj = plot.Proj('lcc', lon_0=105,lat_0=90)
proj2 = plot.Proj('lcc', lon_0=115,lat_0=90)
fig,ax = plot.subplots(figsize=(5, 5), frameon=True,projection=proj)
ax.format(grid=False)
ax.set_extent([80,130, 15, 55], crs=ccrs.PlateCarree())
ax.add_feature(cfeature.COASTLINE.with_scale('50m'))
fig.canvas.draw()
xticks = list(range(65, 185, 20))
yticks = list(range(0, 50, 10))
ax.gridlines(xlocs=xticks, ylocs=yticks,linestyle='--',linewidth = 2,color='lightgrey')
ax.xaxis.set_major_formatter(LONGITUDE_FORMATTER)
ax.yaxis.set_major_formatter(LATITUDE_FORMATTER)
lambert_xticks(ax, xticks)
lambert_yticks(ax, yticks)
ax.tick_params(which='major', width=2, length=7)
ax.tick_params(labelsize=15,pad=5)
ax.outline_patch.set_visible(False)
ins = ax.inset_axes([0.825,0.001,0.2,0.2],projection =proj2)
ins.set_extent([105, 125, 0, 25],crs=ccrs.PlateCarree())
ins.add_feature(cfeature.COASTLINE.with_scale('10m'),lw=0.2)
ins.format(grid=False)
xticks = list(range(65, 185, 10))
yticks = list(range(0, 50, 10))
ins.gridlines(xlocs=xticks, ylocs=yticks,linestyle='--',linewidth = 1,color='lightgrey')
fig.savefig('p6.jpg',dpi=500)