

import matplotlib.pyplot as plt
import cartopy.crs as ccrs

plot.rc['figure.facecolor'] = 'w'
#%config InlineBackend.figure_format = 'svg'
%matplotlib inline
plt.rc('font',family="Arial")#'Times New Roman')
plt.rcParams['axes.unicode_minus'] = False
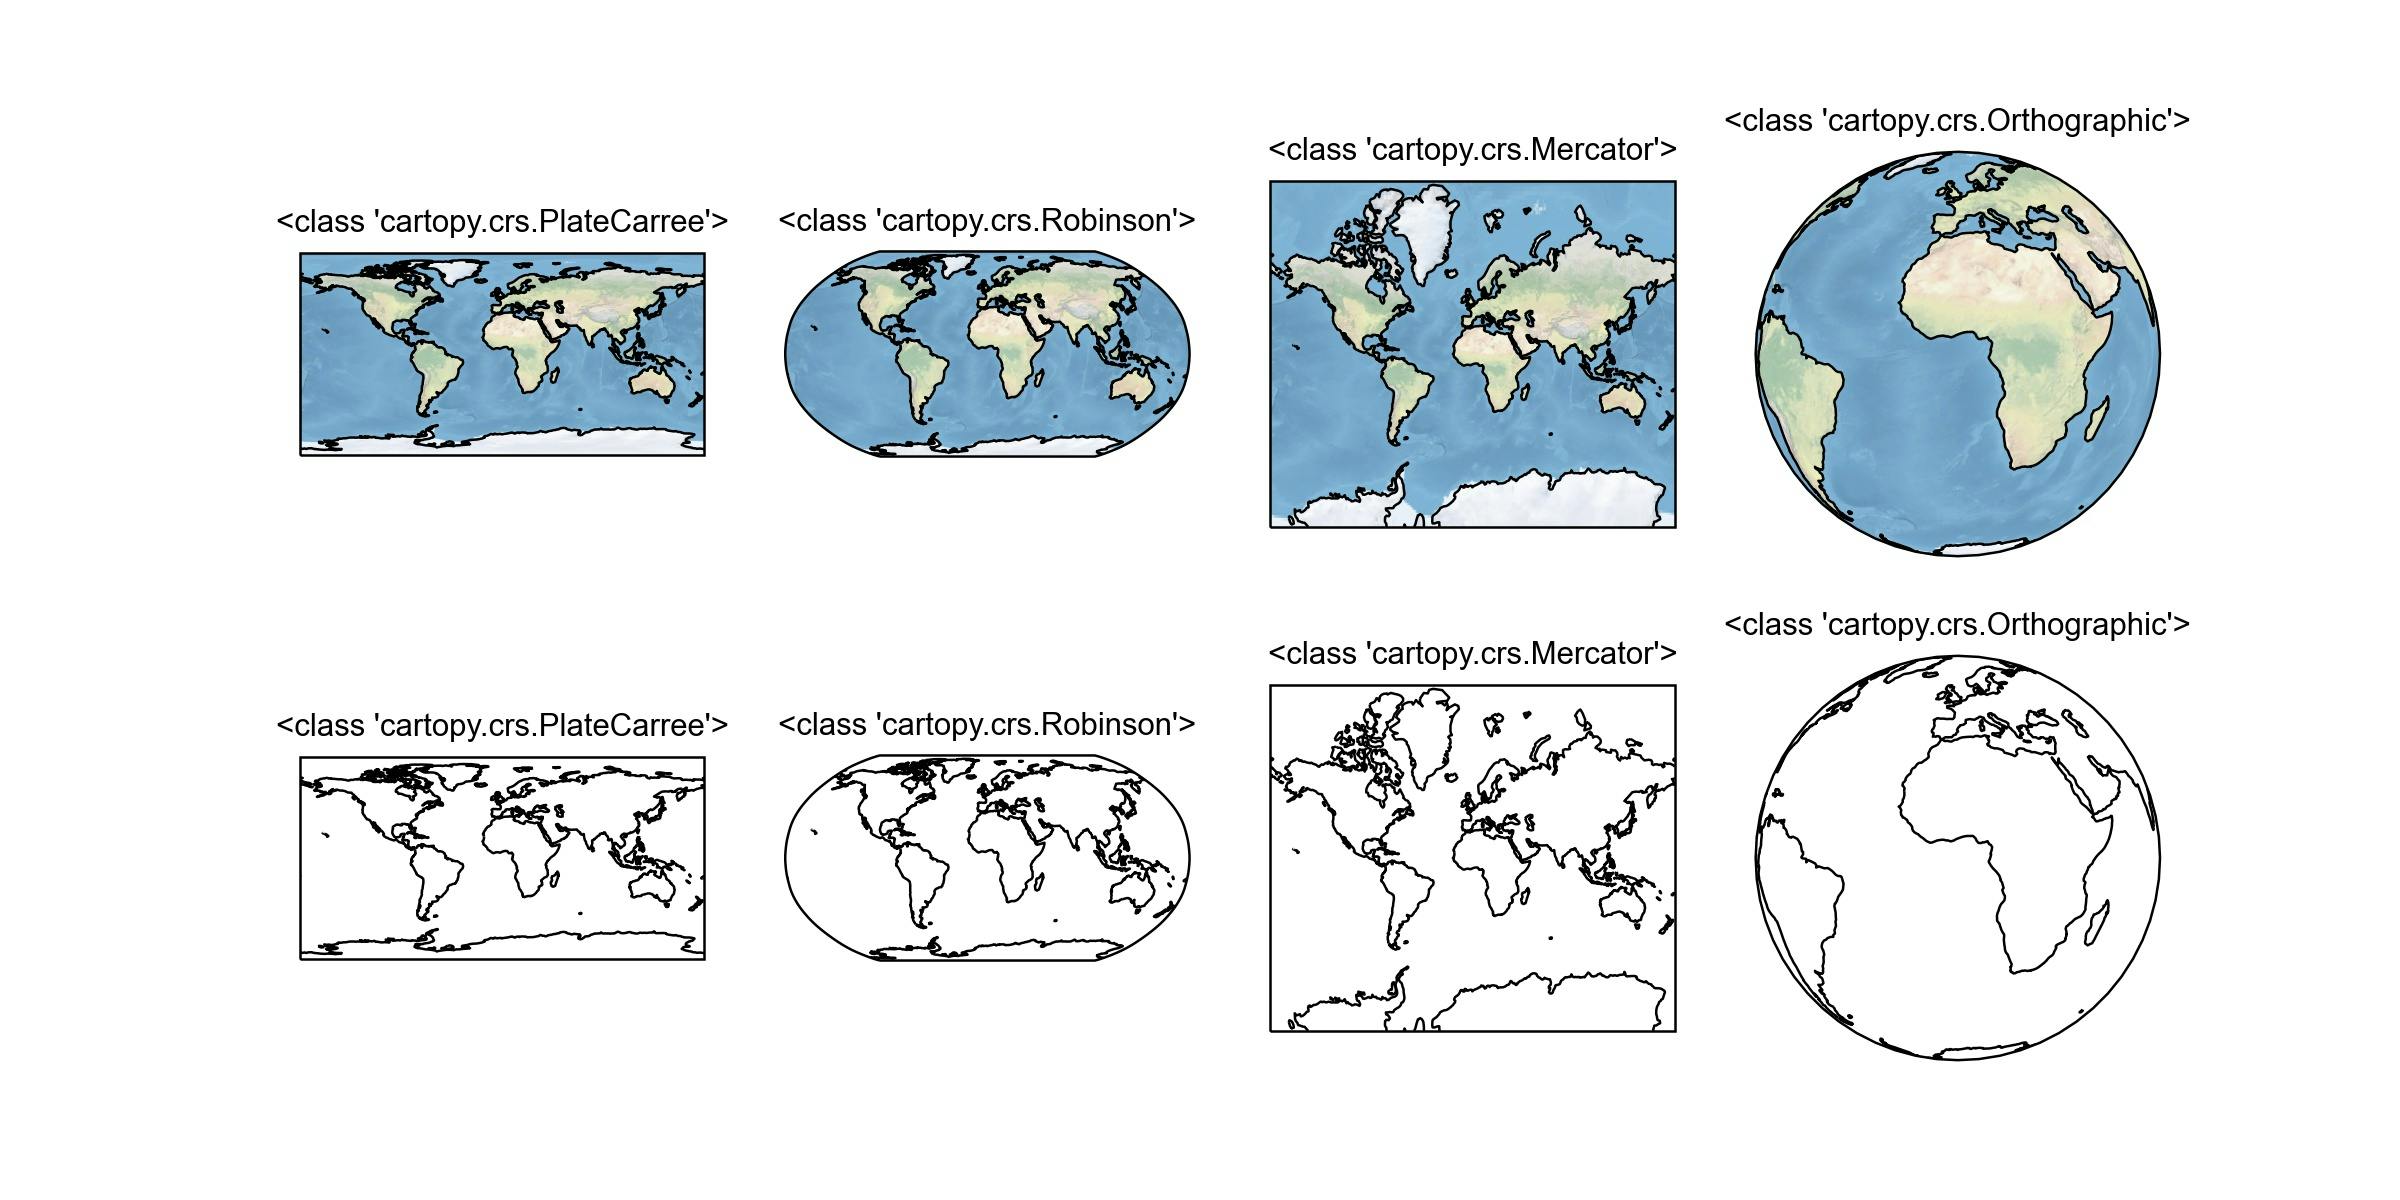
# 选取多种投影
projections = [
    ccrs.PlateCarree(),
    ccrs.Robinson(),
    ccrs.Mercator(),
    ccrs.Orthographic()
]

# 画出多子图
fig = plt.figure(figsize=(8,4))
for i, proj in enumerate(projections, 1):
    ax = fig.add_subplot(2, 4, i, projection=proj)
    ax.stock_img()  # 添加低分辨率的地形图
    ax.coastlines()
    ax.set_title(f'{type(proj)}', fontsize='small')

for i, proj in enumerate(projections, 1):
    ax = fig.add_subplot(2, 4, i+4, projection=proj)
    #ax.stock_img()  # 添加低分辨率的地形图
    ax.coastlines()
    ax.set_title(f'{type(proj)}', fontsize='small')

plt.savefig('map1.jpg',dpi=300)
plt.show()
proplot方法
proplot内置cartopy和basemap,可选择投影方式,适合画组图,用法基本和matplotlib一致
import proplot as plot
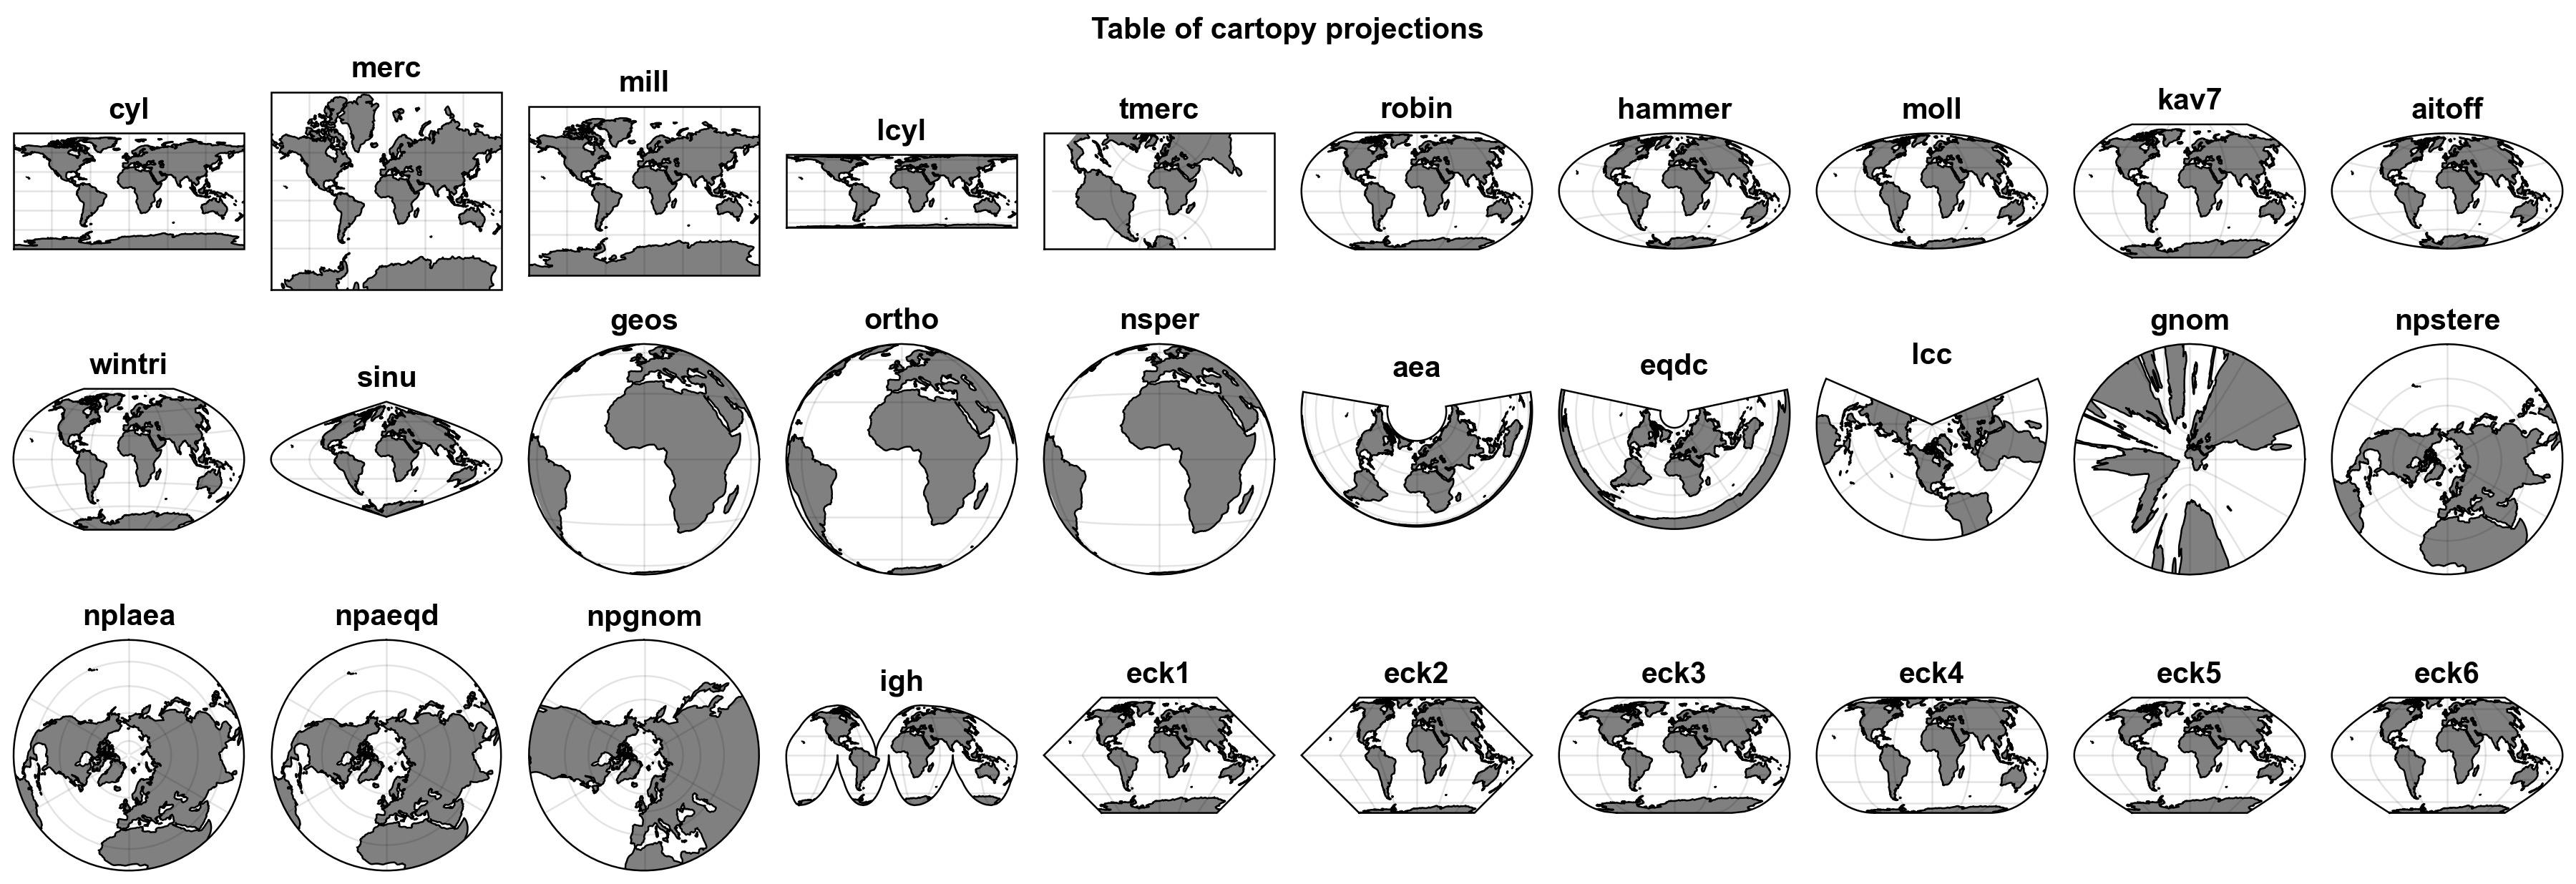
# Table of cartopy projections
projs = [
'cyl', 'merc', 'mill', 'lcyl', 'tmerc',
'robin', 'hammer', 'moll', 'kav7', 'aitoff', 'wintri', 'sinu',
'geos', 'ortho', 'nsper', 'aea', 'eqdc', 'lcc', 'gnom',
'npstere', 'nplaea', 'npaeqd', 'npgnom', 'igh',
'eck1', 'eck2', 'eck3', 'eck4', 'eck5', 'eck6'
]
fig, axs = plot.subplots(ncols=10, nrows=3, width=10, proj=projs)
axs.format(
land=True,landcolor='grey',coast=True, reso='lo', labels=False,
suptitle='Table of cartopy projections'
)
for proj, ax in zip(projs, axs):
ax.format(title=proj, titleweight='bold', labels=False)
plt.savefig('fig1/map2.jpg',dpi=300)
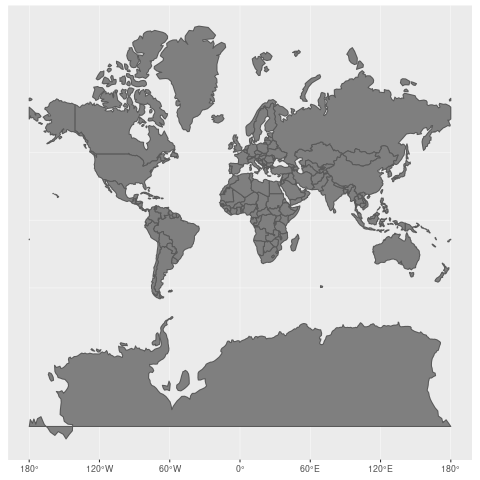
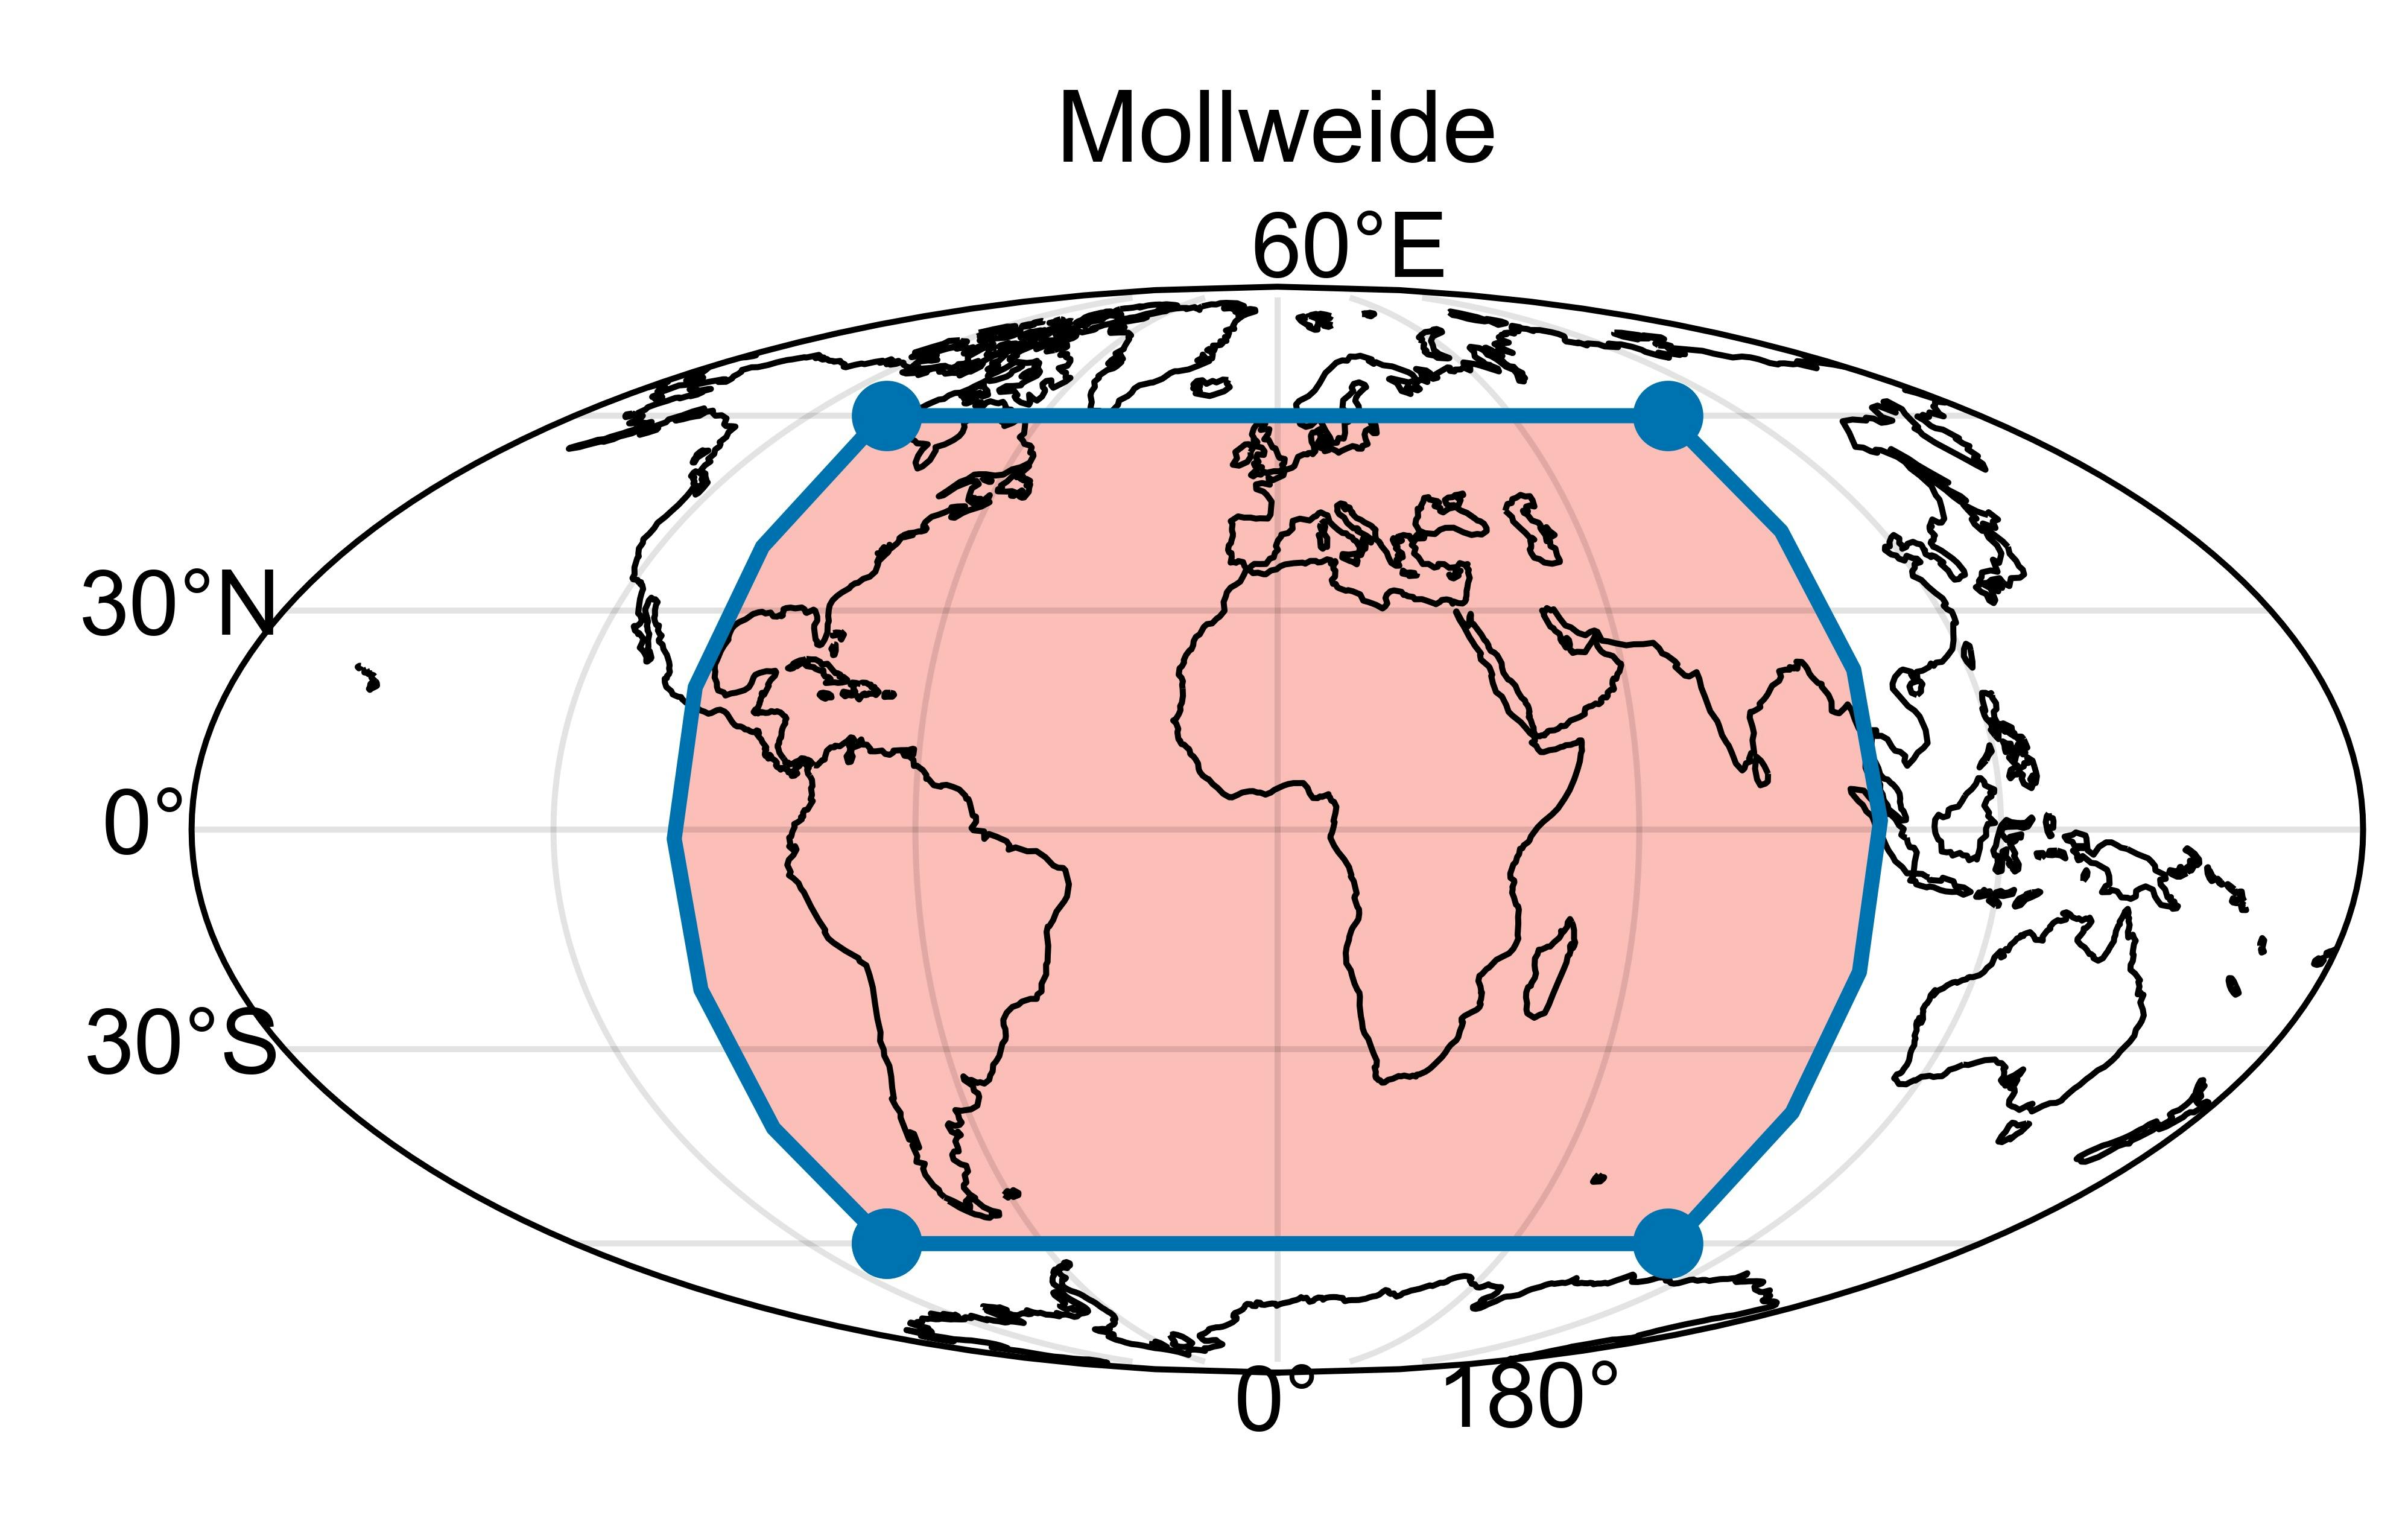
x = [-100.0, -100.0, 100.0, 100.0, -100.0]
y = [-60.0, 60.0, 60.0, -60.0, -60.0]
map_proj = [ccrs.PlateCarree(), ccrs.Mollweide()]
data_proj = ccrs.PlateCarree()

fig,ax2 = plot.subplots(ncols=1, nrows=1, axwidth=5, proj=map_proj[1])
#ax2.stock_img()
ax2.plot(x, y, marker='o', transform=data_proj)
ax2.fill(x, y, color='coral', transform=data_proj, alpha=0.4)
ax2.set_title('Mollweide')
ax2.format(coast=True,labels=True)
NCL高仿
proplot 版本
import xarray as xr

import cartopy.feature as cfeature
import matplotlib .pyplot as plt
import cartopy.crs as ccrs

import numpy as np
import proplot as plot
%matplotlib inline
import matplotlib.colors as colors
import cmaps
from matplotlib.ticker import FuncFormatter
import cartopy.io.img_tiles as cimgt
from cartopy.mpl.ticker import LongitudeFormatter, LatitudeFormatter
plt.rc('font',family="Arial")#'Times New Roman')

plot.rc['figure.facecolor'] = 'w'
#%config InlineBackend.figure_format = 'svg'
%matplotlib inline

plt.rcParams['axes.unicode_minus'] = False
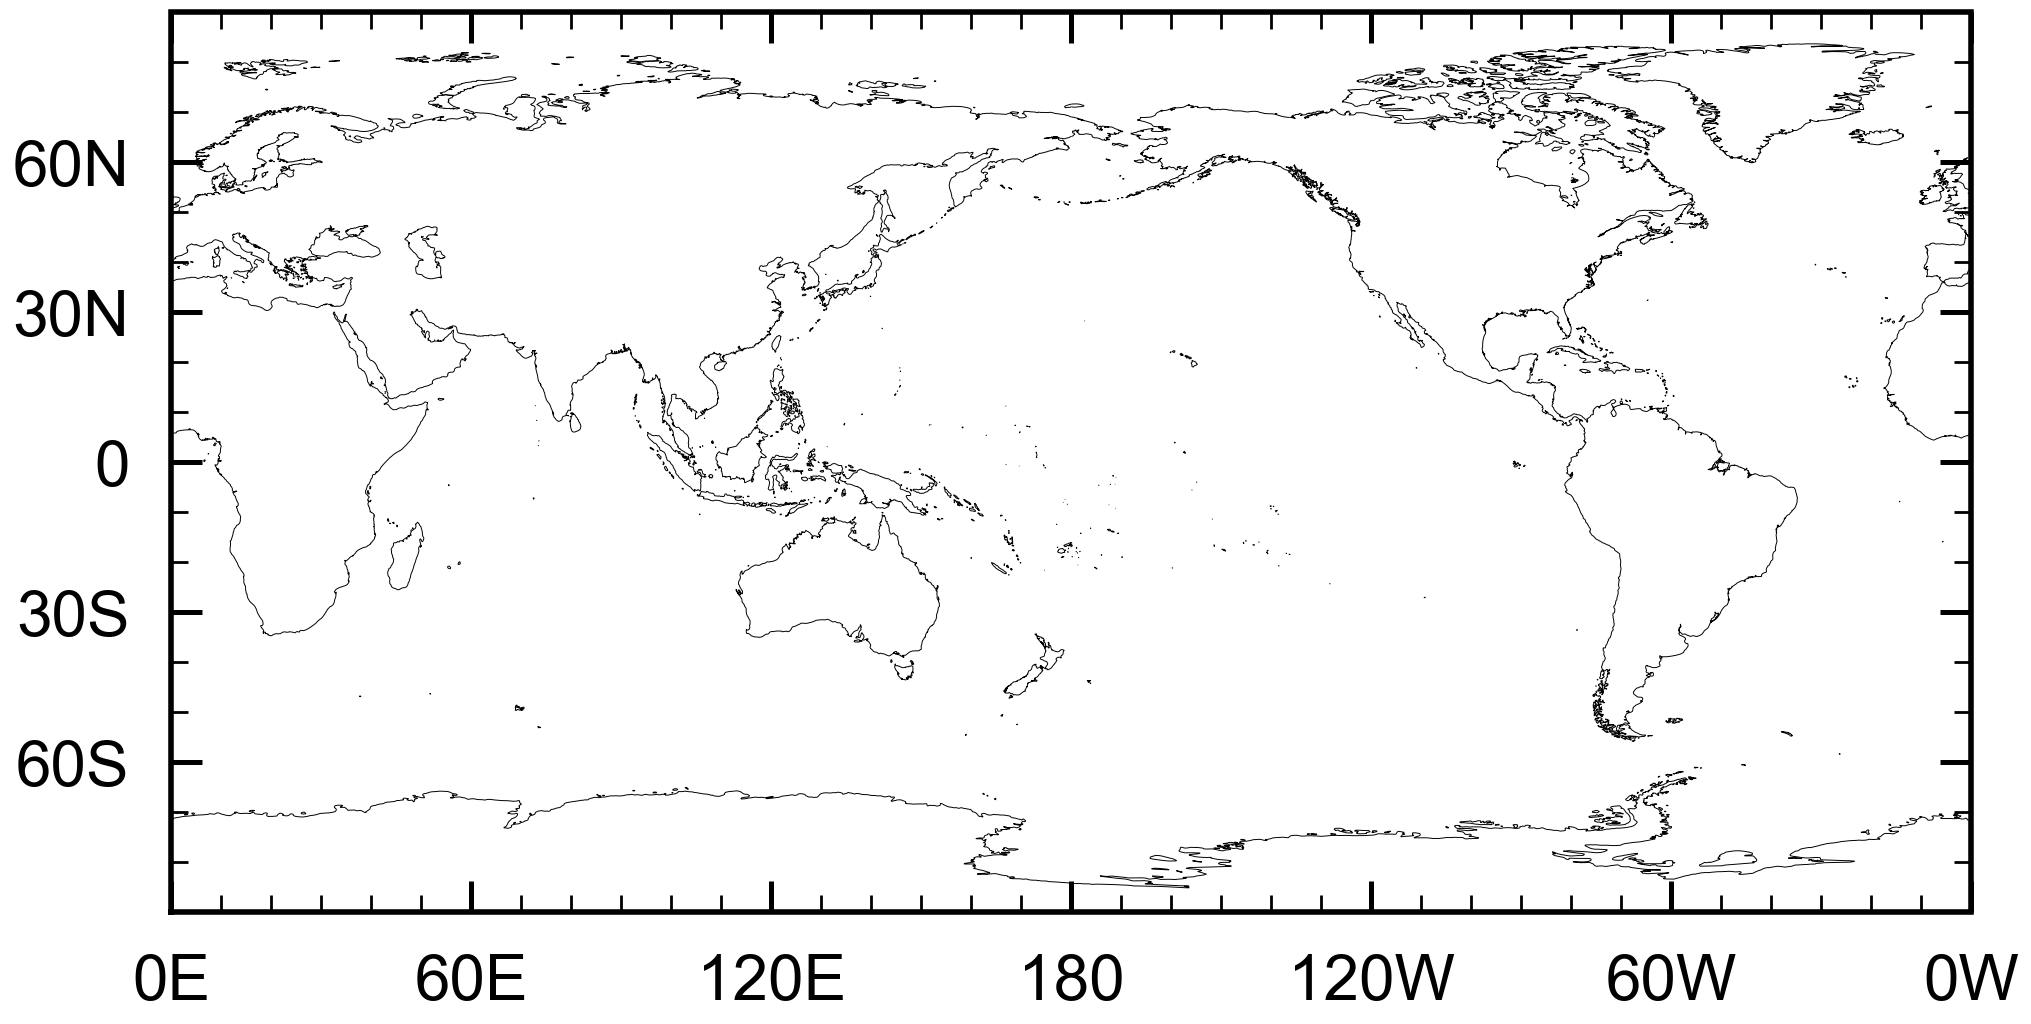
fig,axs = plot.subplots(axheight=6,axwidth=9, proj='cyl', proj_kw={'lon_0': 180})


#ax1.set_global()

axs.outline_patch.set_linewidth(2)

axs.format(grid=False)


axs.add_feature(cfeature.COASTLINE.with_scale('50m'),lw=0.35)

extent = [-180,180,-90, 90] # Contiguous US bounds


extent = [-180,180,-90, 90] # Contiguous US bounds


axs.set_xticks(np.linspace(extent[0],extent[1],7),crs=ccrs.PlateCarree()) # set longitude indicators

axs.set_yticks([-60, -30, 0, 30, 60], crs=ccrs.PlateCarree())
lon_formatter = LongitudeFormatter(zero_direction_label=True,number_format='.0f',degree_symbol='')
lat_formatter = LatitudeFormatter(number_format='.0f',degree_symbol='')
axs.xaxis.set_major_formatter(lon_formatter)
axs.yaxis.set_major_formatter(lat_formatter)


axs.xaxis.set_tick_params(labelsize=23,direction = 'in', pad=15)
axs.yaxis.set_tick_params(labelsize=23,direction = 'in', pad=15)


axs.minorticks_on()
axs.xaxis.set_minor_locator(plt.MultipleLocator(10))

axs.xaxis.set_major_locator(plt.MultipleLocator(60))

axs.yaxis.set_minor_locator(plt.MultipleLocator(10))

axs.tick_params(which='both',direction='in',length=6,width=1,top='on',#上轴开启了刻度值和轴之间的线
                bottom='on',#x轴关闭了刻度值和轴之间的线
                left='on',
                right='on', )


axs.tick_params(direction='in', length=11, width=1.8, colors='k',
               grid_color='k', grid_alpha=0.5,top='on',#上轴开启了刻度值和轴之间的线
                bottom='on',#x轴关闭了刻度值和轴之间的线
                left='on',
                right='on')

axs.grid(False)
fig,axs = plot.subplots(axheight=6,axwidth=9, proj='cyl', proj_kw={'lon_0': 180})


#ax1.set_global()

axs.outline_patch.set_linewidth(2)


axs.add_feature(cfeature.COASTLINE.with_scale('50m'),lw=0.35)

extent = [-180,180,-90, 90] # Contiguous US bounds


# extent = [-74.257159,-73.699215,40.495992,40.915568] # NYC bounds
#ax1.set_extent(extent) # set extents
axs.set_xticks(np.linspace(extent[0],extent[1],7),crs=ccrs.PlateCarree()) # set longitude indicators
#ax1.set_yticks(np.linspace(extent[2],extent[3],7)[1:],crs=ccrs.PlateCarree()) # set latitude indicators

#ax1.set_xticks([-180, 60, 120, 180, 240, 300, 360], crs=ccrs.PlateCarree())
#ax1.set_xticks([0, 60, 120, 180, 240, 300, 360], crs=ccrs.PlateCarree())
axs.set_yticks([ -90,-60, -30, 0, 30, 60,90], crs=ccrs.PlateCarree())
lon_formatter = LongitudeFormatter(zero_direction_label=True,number_format='.0f',degree_symbol='')
lat_formatter = LatitudeFormatter(number_format='.0f',degree_symbol='')
axs.xaxis.set_major_formatter(lon_formatter)
axs.yaxis.set_major_formatter(lat_formatter)


axs.xaxis.set_tick_params(labelsize=23,direction = 'in', pad=15)
axs.yaxis.set_tick_params(labelsize=23,direction = 'in', pad=15)


axs.minorticks_on()
axs.xaxis.set_minor_locator(plt.MultipleLocator(10))

axs.xaxis.set_major_locator(plt.MultipleLocator(30))

axs.yaxis.set_minor_locator(plt.MultipleLocator(10))

labels = list(['0','60E','120E','180','120W','60W','0'])
#xs = range(10)
xs=[-210,-180,-150,-120,-90,-60,-30,0,30,60,90,120,150,180,210]
xs=[-180,-120,-60,0,60,120,180]
def format_fn(tick_val, tick_pos):
    #print(tick_val)
    #print('end')
    if int(tick_val) in xs:
        a=int(tick_val)/60+3
        return labels[int(a)]#labels[int(tick_val)]
    else:
        return ''
formatter = FuncFormatter(format_fn)


#ax1.xaxis.set_major_formatter(lon_formatter)
axs.xaxis.set_major_formatter(formatter)#plt.NullFormatter())
#ax1.set_xticks([-2 * np.pi, -np.pi, 0, np.pi, 2 * np.pi])

axs.tick_params(which='both',direction='in',length=6,width=1,top='on',#上轴开启了刻度值和轴之间的线
                bottom='on',#x轴关闭了刻度值和轴之间的线
                left='on',
                right='on', )


axs.tick_params(direction='in', length=11, width=1.8, colors='k',
               grid_color='k', grid_alpha=0.5,top='on',#上轴开启了刻度值和轴之间的线
                bottom='on',#x轴关闭了刻度值和轴之间的线
                left='on',
                right='on')


axs.grid(False)
matplotlib 版本
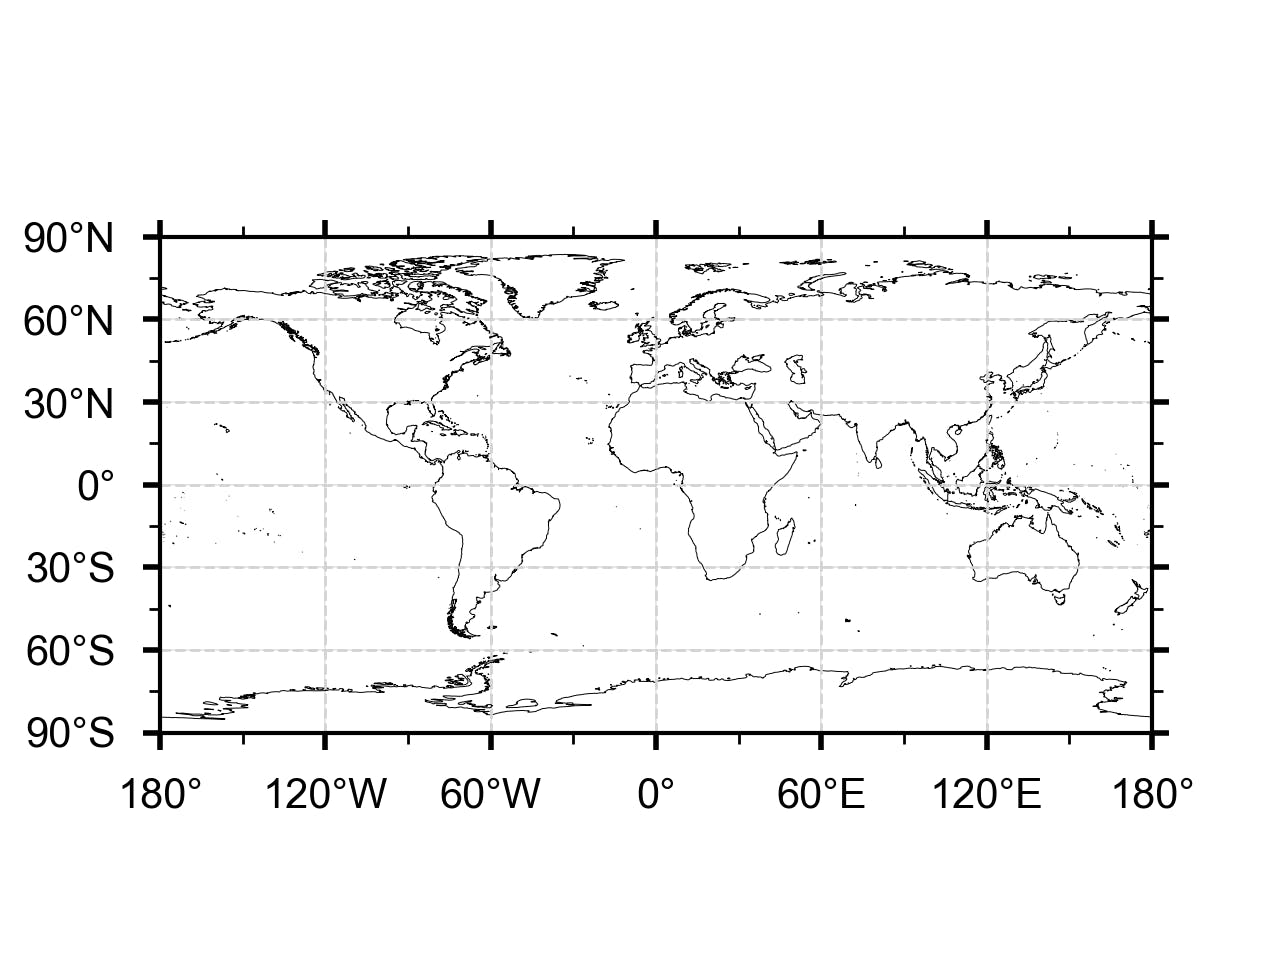
import numpy as np
import matplotlib.pyplot as plt
import cartopy.crs as ccrs
# 导入Cartopy专门提供的经纬度的Formatter
from cartopy.mpl.ticker import LongitudeFormatter, LatitudeFormatter

map_proj = ccrs.PlateCarree()
fig = plt.figure()
ax = fig.add_subplot(111, projection=map_proj)

ax.set_global()
ax.add_feature(cfeature.COASTLINE.with_scale('50m'),lw=0.35)
#ax.stock_img()

# 设置大刻度和小刻度
tick_proj = ccrs.PlateCarree()
ax.set_xticks(np.arange(-180, 180+60, 60), crs=tick_proj)
ax.set_xticks(np.arange(-180, 180+30, 30), minor=True, crs=tick_proj)
ax.set_yticks(np.arange(-90, 90+30, 30), crs=tick_proj)
ax.set_yticks(np.arange(-90, 90+15, 15), minor=True, crs=tick_proj)

# 利用Formatter格式化刻度标签
ax.xaxis.set_major_formatter(LongitudeFormatter())
ax.yaxis.set_major_formatter(LatitudeFormatter())

ax.tick_params(which='minor', width=1, length=4
               ,top='on',#上轴开启了刻度值和轴之间的线
                bottom='on',#x轴关闭了刻度值和轴之间的线
                left='on',
                right='on')
ax.tick_params(which='major', width=2, length=6
              ,top='on',#上轴开启了刻度值和轴之间的线
                bottom='on',#x轴关闭了刻度值和轴之间的线
                left='on',
                right='on')


ax.tick_params(labelsize=15,pad=10)

ax.outline_patch.set_linewidth(1.5)

ax.gridlines(linestyle='--',linewidth = 1,color='lightgrey')

plt.show()